
The installation of InfluxDB and Grafana on Raspberry Pi can be quite the marathon of Terminal commands.
There are various tutorials that explain this process but for this tutorial I have made it possible with just a single terminal command. How is this possible?
It is possible to install InfluxDB and Grafana using the easy installation script for Raspberry Pi, accessible directly from Github via Terminal in a single command.
Table of Contents
- Install InfluxDB & Grafana with the installation script
- Install InfluxDB & Grafana manually
- Setup Grafana
- Conclusion
Install InfluxDB & Grafana with the installation script
I have uploaded the script to the Github repository, you can view the source here. You can either run the script directly from Terminal, or you can download and run the script locally.
Install with a single terminal command
First you need to go to your Raspberry Pi terminal either by connecting using SSH or just opening up the terminal in the GUI.
Copy and paste the following command into the Terminal window and hit enter.
sudo su -c "bash <(wget -qO- https://raw.githubusercontent.com/Siytek/grafana-influx/master/install.sh)" root
The installation will take a few moments and eventually it will prompt you to press enter to setup a database. Make sure you avoid using spaces or it will cause errors in the setup.
Once complete it will present the steps required to open Grafana and connect the database that you just created. I have also documented the required steps towards the end of this post.
Download the script and run
Alternatively you can download the script from Github as a .zip file and save it to a location on your hard drive.
To use it you will need to unzip it to your prefered location, for example in your ~/Documents folder. Open up a terminal and change directory to the location of the script.
cd ~/Documents/grafana-influx-master
Next you can make the script executable by setting the permissions.
chmod u+x install.sh
Finally you can run the installation.
sudo ./install.sh
The installation will take a few moments and eventually it will prompt you to press enter to setup a database. Make sure you avoid using spaces or it will cause errors in the setup.
Once complete it will present the steps required to open Grafana and connect the database that you just created. I have also documented the required steps towards the end of this post.
Install InfluxDB & Grafana manually
If you have trouble with the script or you just want to feel more like a hacker, you can install InfluxDB & Grafana manually in the terminal. Go ahead and open the terminal.
Add Grafana repositories to apt
First we will install Grafana by adding the repositories to apt, go ahead and paste the following command into the terminal window.
wget -q -O - https://packages.grafana.com/gpg.key | sudo apt-key add -
echo "deb https://packages.grafana.com/oss/deb stable main" | sudo tee /etc/apt/sources.list.d/grafana.list
Install Grafana
Next we can run apt update and install.
apt update && sudo apt install grafana
Start Grafana service
Once the installation has completed we need to start the service and set it to start each time the system boots.
systemctl unmask grafana-server.service
systemctl start grafana-server
systemctl enable grafana-server.service
Add InfluxDB repositories to apt
Next we will install InfluxDB by adding the repositories to apt, go ahead and paste the following command into the terminal window.
wget -qO- https://repos.influxdata.com/influxdb.key | sudo apt-key add -
source /etc/os-release
echo "deb https://repos.influxdata.com/debian $(lsb_release -cs) stable" | sudo tee /etc/apt/sources.list.d/influxdb.list
Install InfluxDB
Once the installation has completed we need to start the service and set it to start each time the system boots.
apt-get update && apt-get install influxdb
Start InfluxDB service
Once the installation has completed we need to start the service and set it to start each time the system boots.
sudo systemctl unmask influxdb.service
sudo systemctl start influxdb
sudo systemctl enable influxdb.service
Create a database
Now that everything is installed, we can create a database in InfluxDB. First we need to launch the InfluxDB CLI with the following command.
influx
From the InfluxDB command prompt we can start by creating a new database. Be sure to replace the <tags> with your desired values.
create database <your-database-name>
use <your-database-name>
Create a user and set privileges
Once we have created a database, we can add a new user and set the privileges.
create user <your-user-name> with password '<your-password>' with all privileges
grant all privileges on <your-user-name> to <your-password>
Setup Grafana
Now you should have Grafana and InfluxDB installed either with the script or by manually entering the commands. You should also have a new database and user set up.
Log in to Grafana
Next we need to access Grafana using a browser, so go ahead and enter the following address.
http://<your-pi-ip-address>:3000
The first time you visit the Grafana configuration page you will be presented with a login screen.
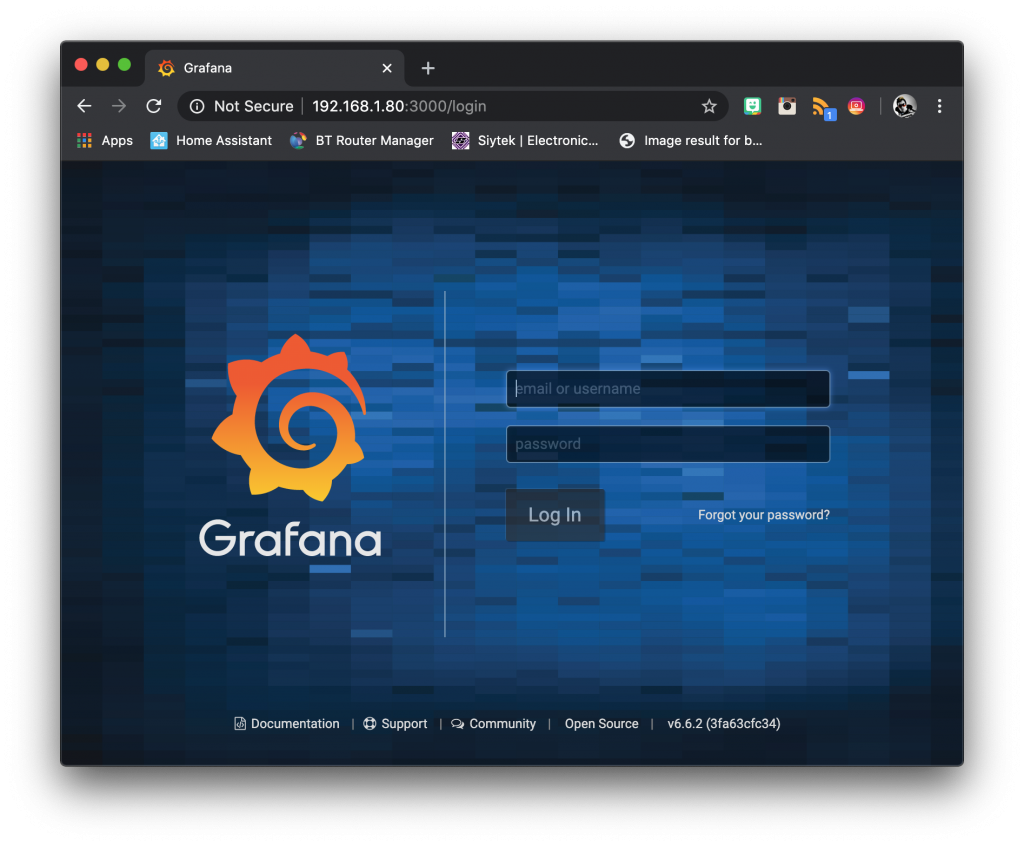
Enter the default user name admin and password admin. Once you login you will be prompted to update the password.
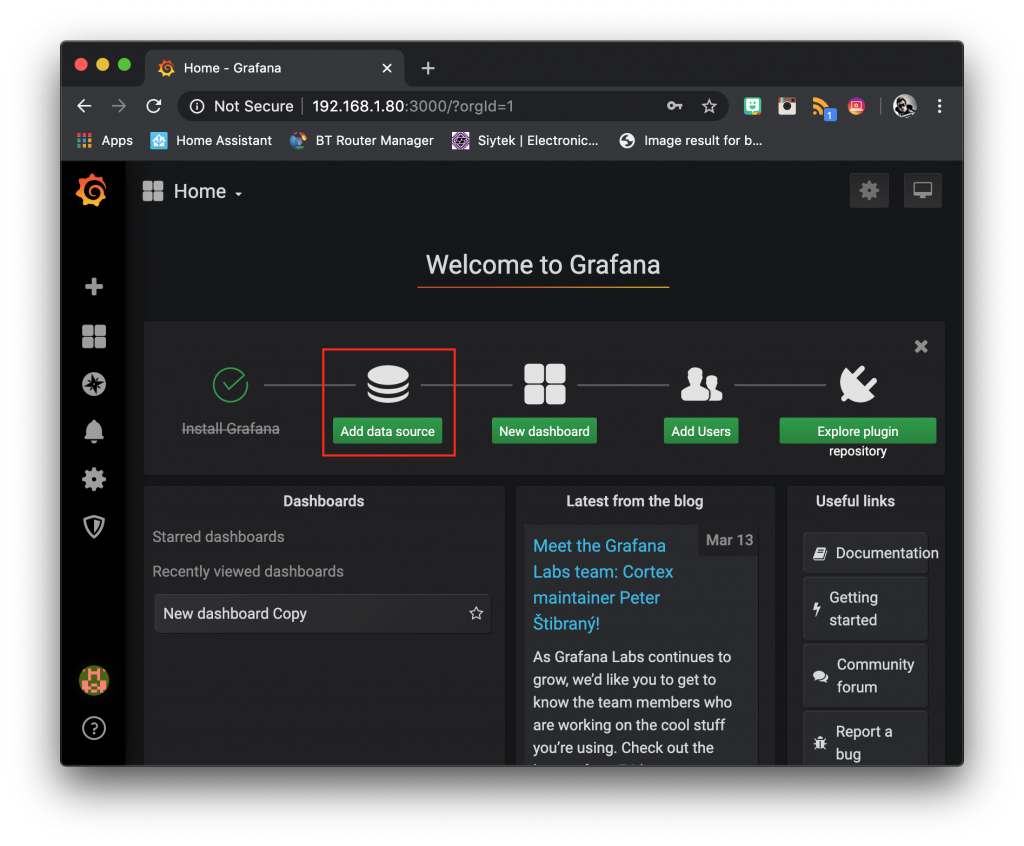
Add a data source
Next we need to enter a data source, which will be our InfluxDB database. Click on add data source.
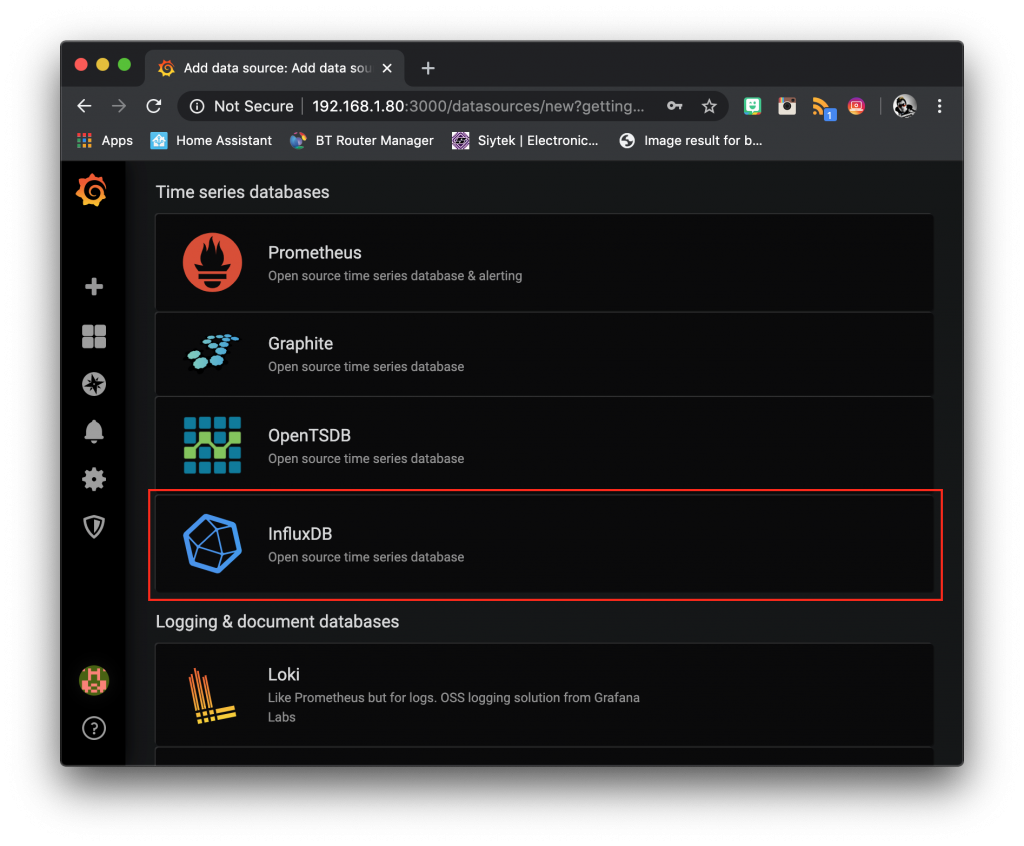
Select InfluxDB from time series databases.
Enter a reference name for your data source, or you can leave it as default. Enter the URL as http://<your-pi-ip-address>:8086
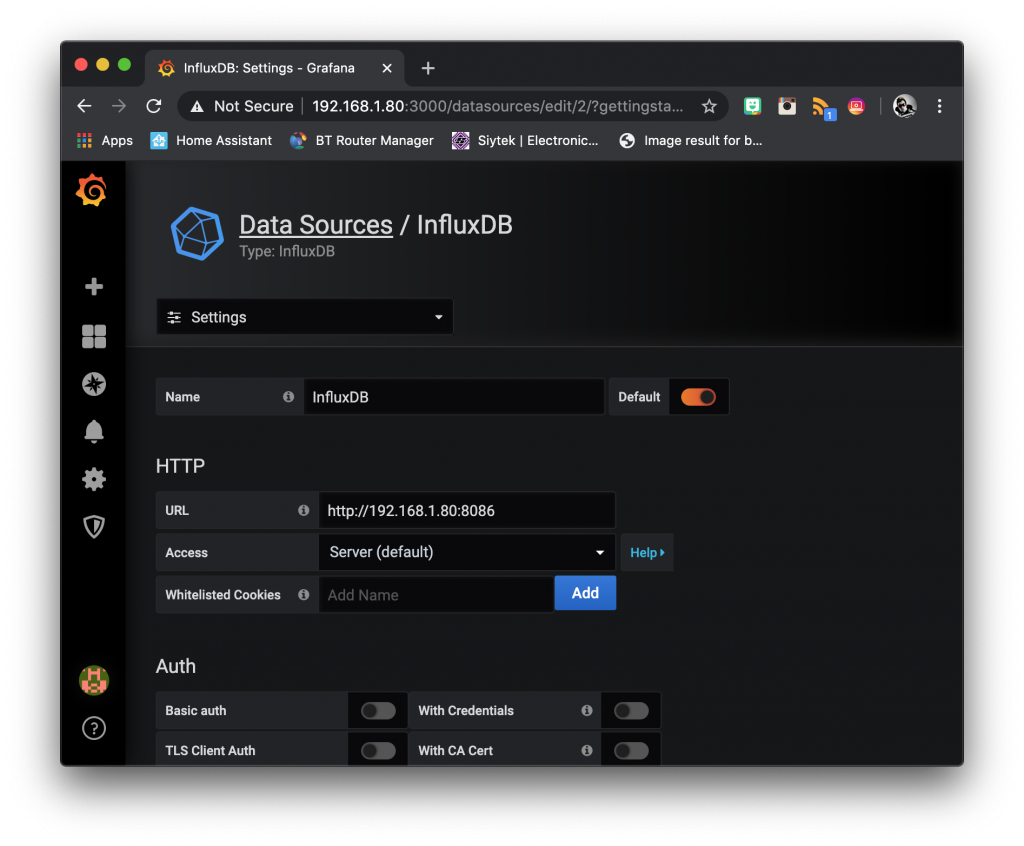
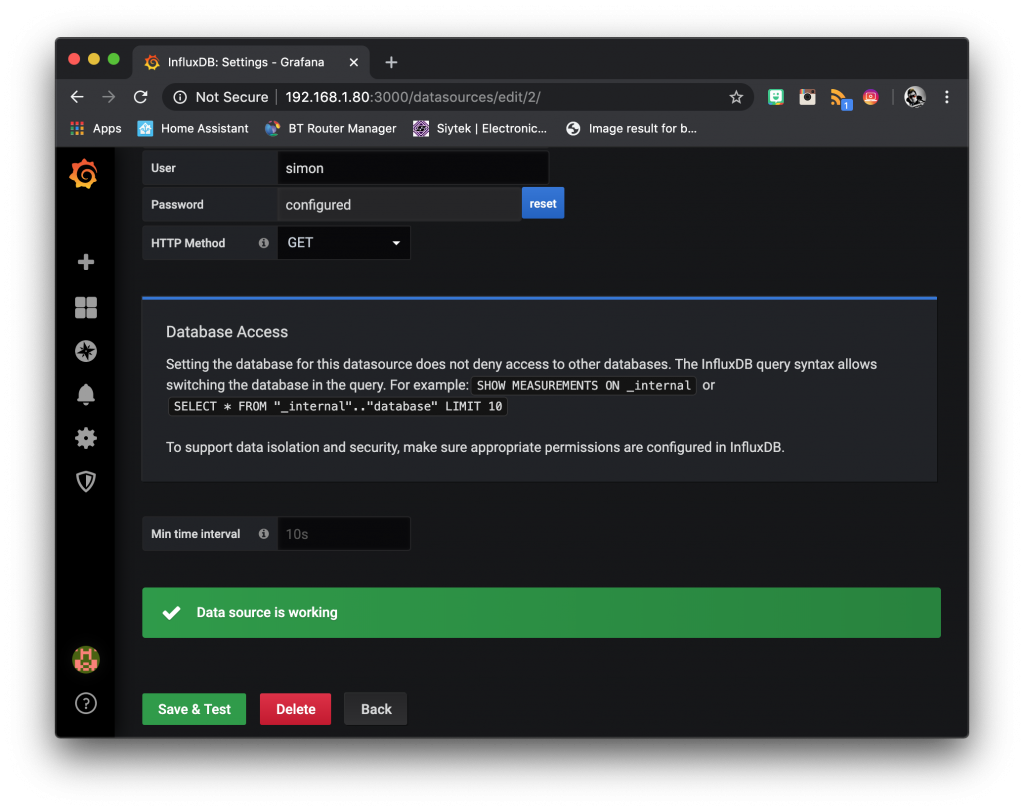
Enter the database name, user and password that you chose during the InfluxDB setup. The HTTP method should be set to GET. Click on save & test and if everything worked ok you will receive the data source is working message.
Conclusion
In this tutorial we have covered several ways to install and setup InfluxDB and Grafana on Raspberry Pi.
This method is ideal if you want to run InfluxDB and Grafana on a seperate Raspberry Pi. If you are running Home Assistant then it can be beneficial to have a seperate Pi so as not to load the Home Assistant server CPU too much.
Thanks so much for visiting my site! If this article helped you achieve your goal and you want to say thanks, you can now support my work by buying me a coffee. I promise I won't spend it on beer instead... 😏